Azure Monitoring & Diagnostics
Are you ready to score big with your cloud monitoring and diagnostics game, Liverpool fans?
Azure Monitoring and Diagnostics are like the coaches and physios of your cloud computing team, helping you monitor, diagnose, and troubleshoot your applications and infrastructure on the cloud.
They help you monitor, diagnose, and troubleshoot your applications and infrastructure on the cloud, using Azure Monitor, Application Insights, and Log Analytics.
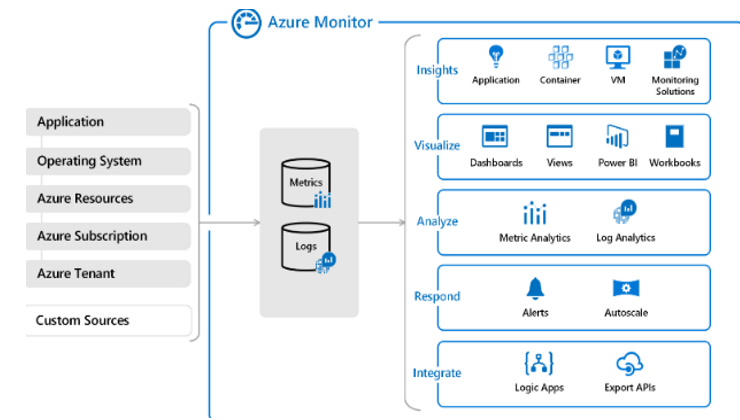
Azure Monitor
To get started with Azure Monitoring and Diagnostics, you’ll need to configure Azure Monitor for logging and metrics.
This is like tracking the stats and performance of your team players.
Azure Monitor allows you to collect and analyze data from various sources, including Azure resources, applications, and services, and create alerts and notifications based on the metrics and logs.
Here’s how you can configure Azure Monitor for logging and metrics using the Azure Portal:
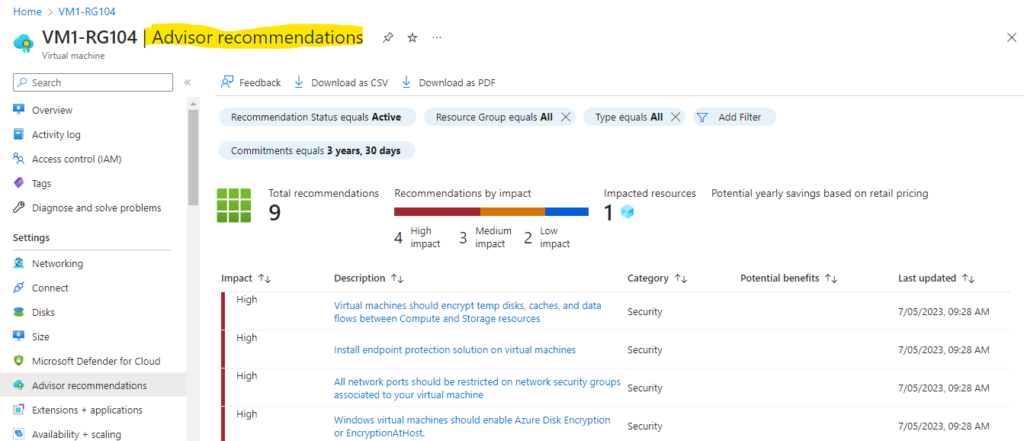
- Log in to the Azure Portal and select Azure Monitor from the left-hand menu.
- Configure the data sources and collection rules for Azure resources, applications, and services, specifying the metrics and logs you want to track.
- Create alerts and notifications based on the metrics and logs, specifying the conditions and actions you want to take.
Once you’ve configured Azure Monitor, you can start using Application Insights to monitor and diagnose application performance.
Application Insights
Application Insights is like the physio of your cloud monitoring and diagnostics game.
It allows you to monitor and diagnose the performance of your applications, using real-time telemetry and diagnostics data.
Here’s how you can use Application Insights to monitor and diagnose application performance using the Azure Portal:
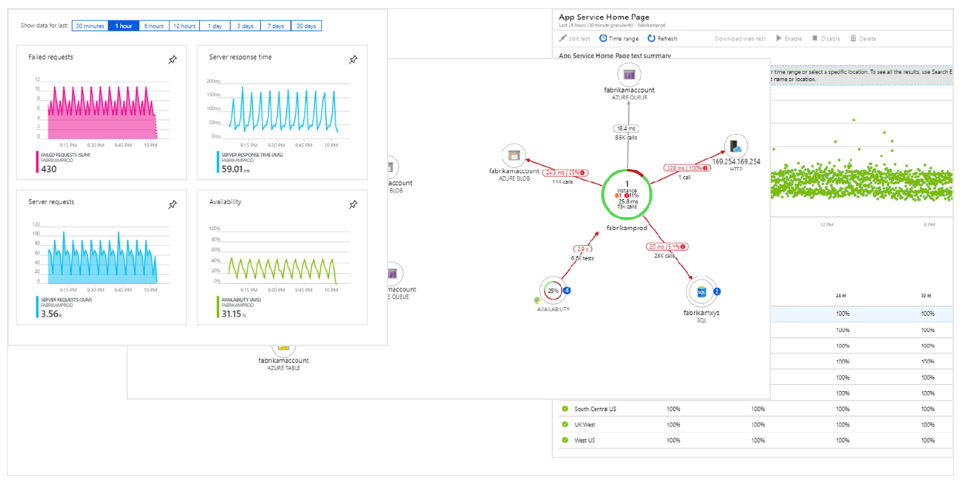
- Log in to the Azure Portal and select Application Insights from the left-hand menu.
- Configure the telemetry and diagnostics settings for your application, specifying the metrics and logs you want to track.
- Use the real-time telemetry and diagnostics data to monitor and diagnose the performance of your application, identifying and troubleshooting issues and bottlenecks.
Log Analytics
Log Analytics, on the other hand, is like the coach of your cloud monitoring and diagnostics game.
It allows you to perform advanced log queries and analysis, using a powerful and flexible query language.
Here’s how you can use Log Analytics for advanced log queries and analysis using the Azure Portal:
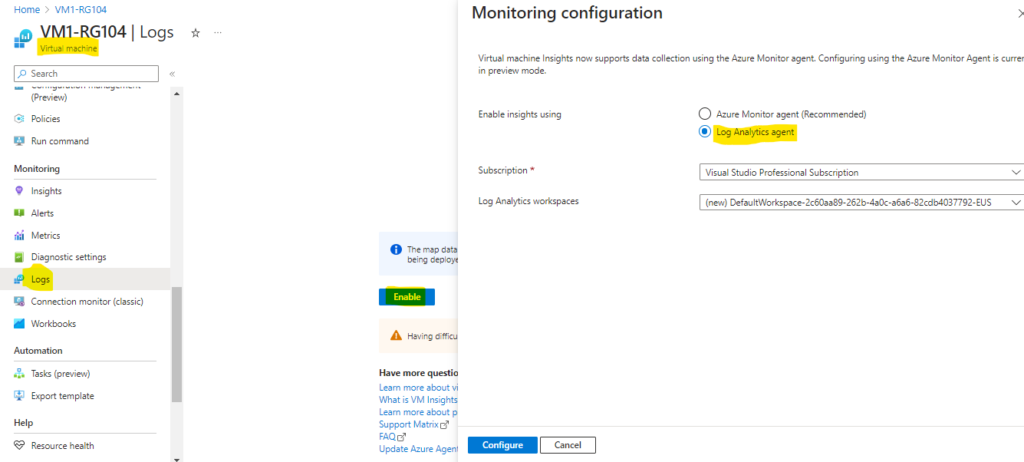
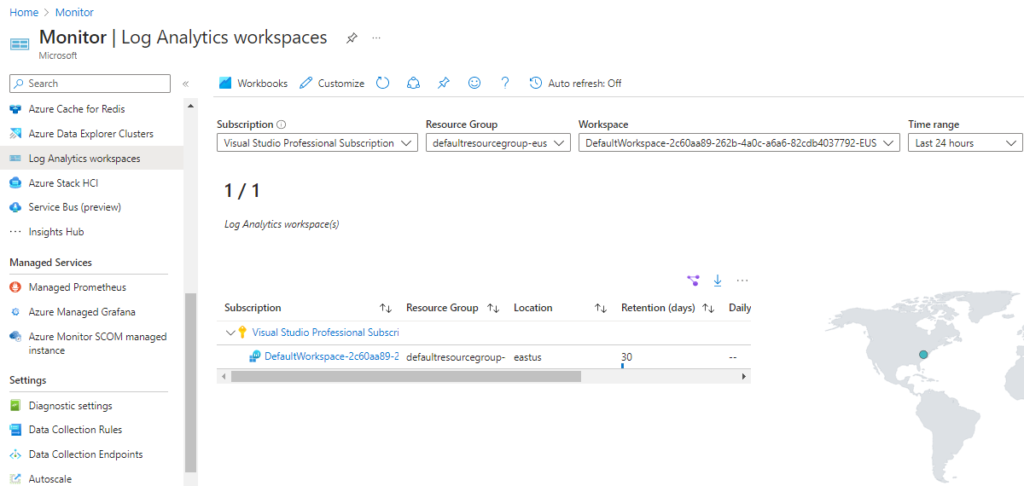
- Log in to the Azure Portal and select Log Analytics from the left-hand menu.
- Configure the data sources and collection rules for your logs, specifying the log types and sources you want to track.
- Use the query language to perform advanced log queries and analysis, identifying patterns and trends, and troubleshooting issues and bottlenecks.
Conclusion
With Azure Monitoring and Diagnostics, you can monitor, diagnose, and troubleshoot your applications and infrastructure like a pro, using Azure Monitor, Application Insights, and Log Analytics.
Whether you’re configuring Azure Monitor or using Log Analytics for advanced log queries and analysis, Azure Monitoring and Diagnostics have you covered.
So get in the game and start using Azure Monitoring and Diagnostics today!
Peace out!